
LandLogic for Professionals
The intelligence platform
for building what’s next.
LandLogic delivers complete parcel-level intelligence to power the future of land-use products.
TRUSTED BY


BIG NEWS!
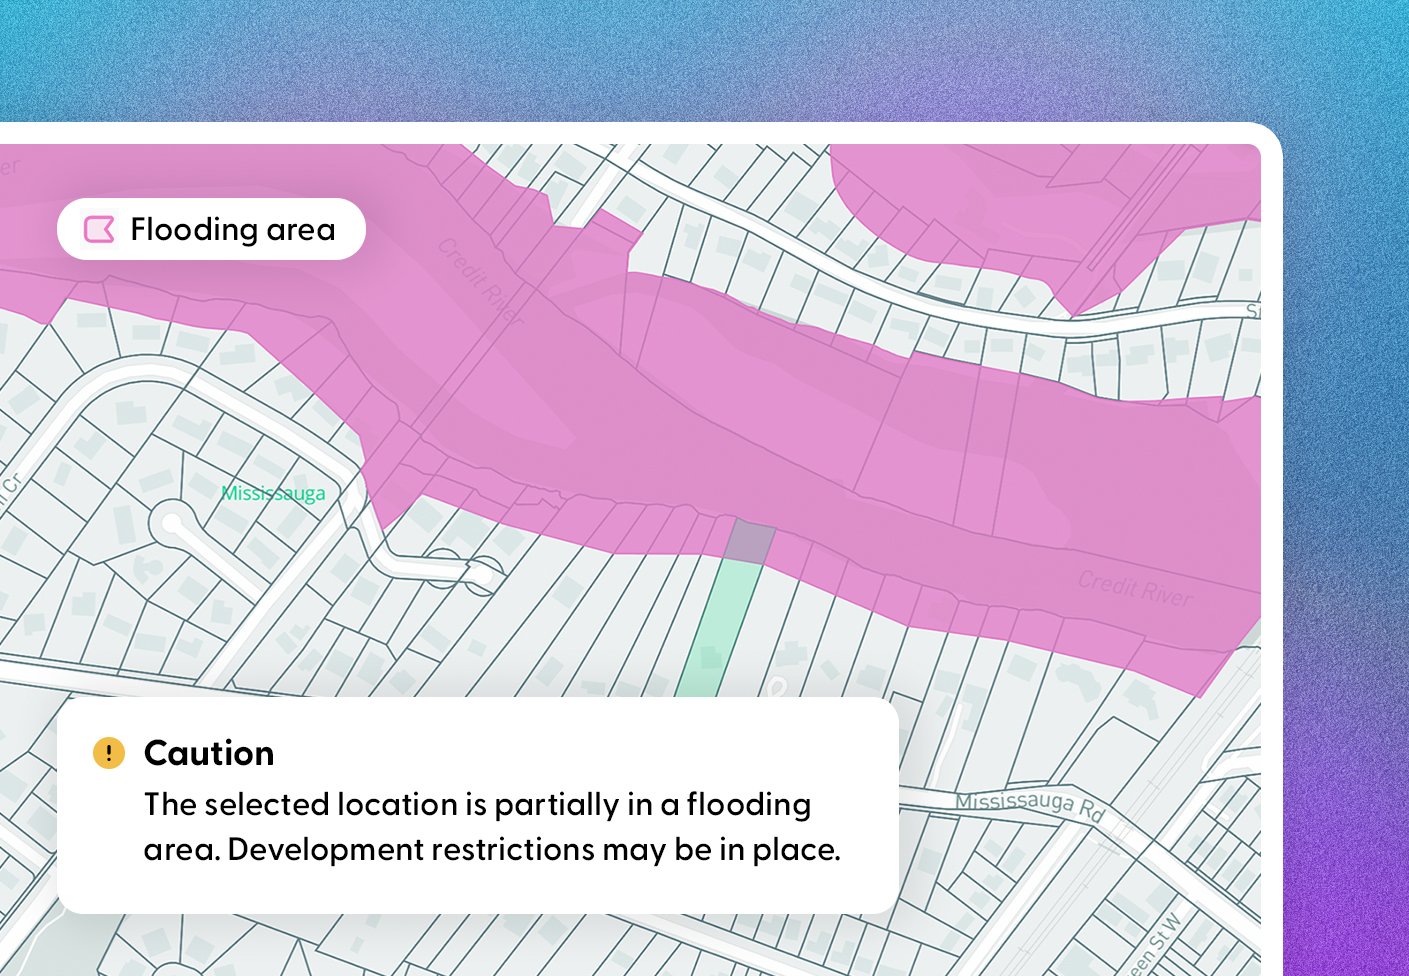
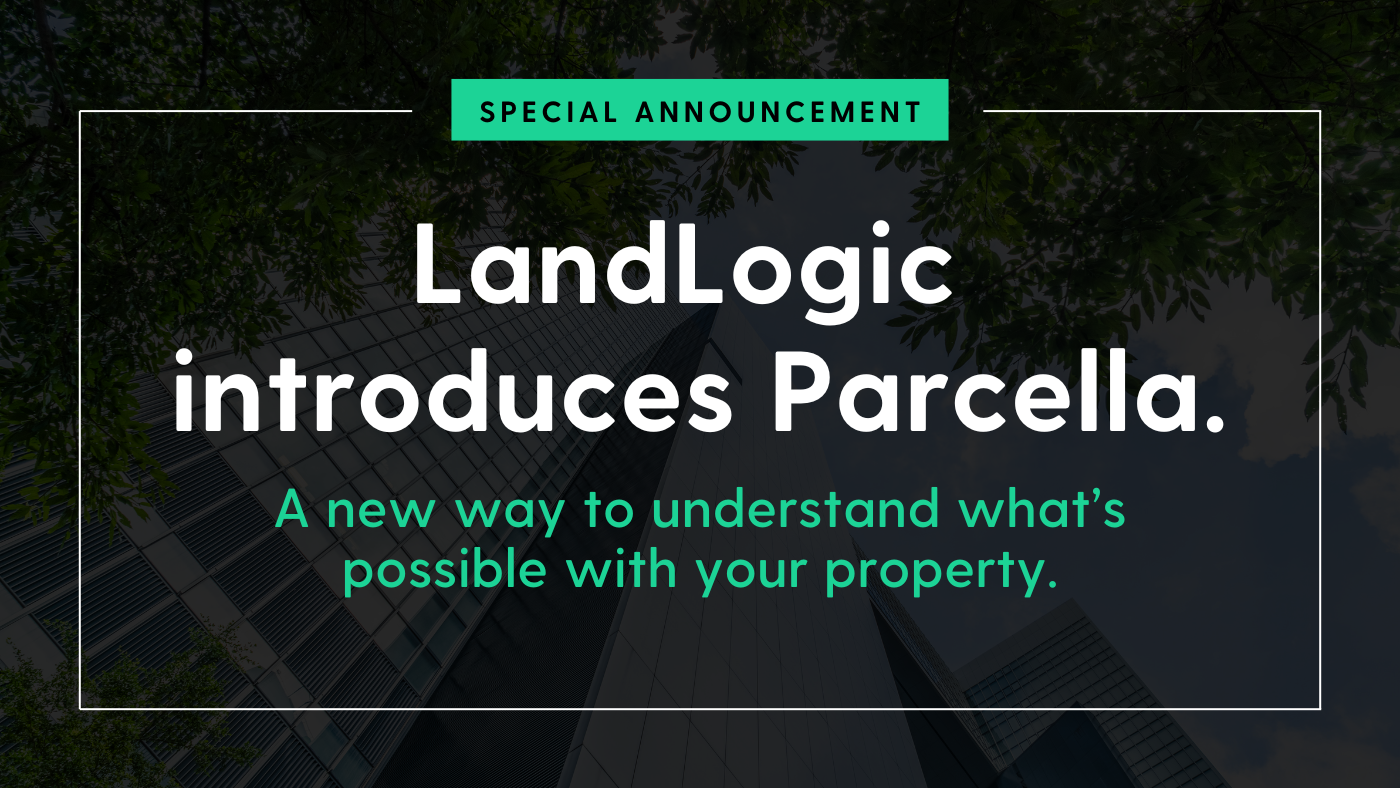
Introducing a new way to understand what’s possible with your property.
LandLogic has launching a new way for property owners to understand what’s possible with their property—so they can make the right call before spending time or money.
Built on intelligence
The foundation powering
every land-use product.
Our intelligence platform gives every product the advantage of launching with standardized data, built-in connectivity, and long-term scalability.
Data studio
Simplify your site search and due diligence! Find and assess viable properties in minutes. Just sign up and search.

Conversational AI
Interact with contextual property intelligence in a natural language platform.

Enterprise integration
Integrate LandLogic into your system to supercharge your team and clients.

Testimonials
Getting real results
from real intelligence.
Discover how actual industry professionals are using LandLogic's intelligence platform every day.

-
![Teranet logo with a green stylized letter A on the left and gray text 'TERANET' on the right]()
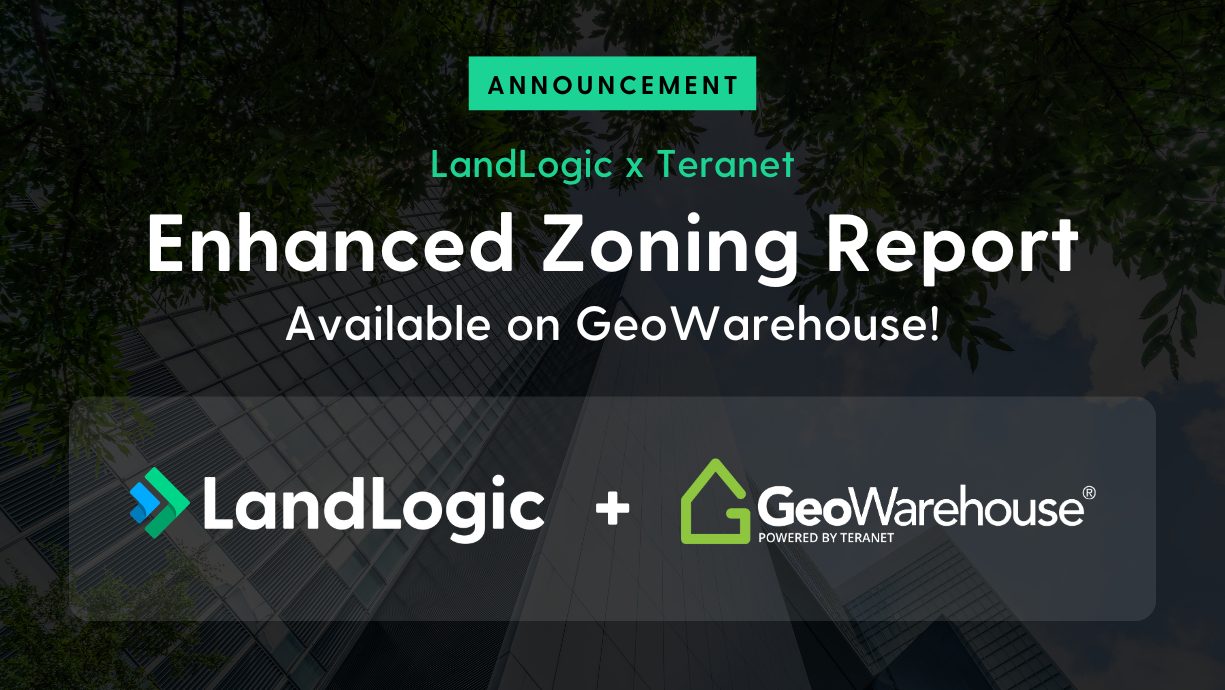
“Our partnership with LandLogic brings a new layer of zoning intelligence to GeoWarehouse. By delivering standardized, easy-to-understand zoning reports, we’re giving real estate professionals the clarity and speed they need at the start of every analysis. It’s exactly the kind of practical innovation our community expects from Teranet.”
Tim Rye, Senior Vice President, Commercial Solutions
» Teranet Inc « -
![DEVNEX logo with pink geometric icon on the left.]()
"For Devnex, every project is a strategic investment. LandLogic’s integration with our proptech stack means we can layer zoning intelligence alongside compliance tools and site evaluation in one seamless workflow. It’s become an indispensable part of how we assess and execute opportunities."
Dr. Amin Sarang, CEO
» DEVNEX « -
![Teranet logo with a green stylized arrow and the word 'TERANET' in gray.]()
“With LandLogic’s reports embedding directly into our platform, zoning insight is now a few clicks away in GeoWarehouse. Real Estate Professionals can quickly verify designations and constraints without hunting through bylaws, which streamlines due diligence and reduces risk. It’s helped our users work smarter while reinforcing GeoWarehouse as the place to start every property decision.”
Shawn Greenly, Vice President, Product Management
» Teranet Inc « -
![AECORN logo with blue arrow-shaped logo with five horizontal lines stacked in a zigzag pattern on a white background.]()
“LandLogic’s zoning intelligence has become an integral part of how we assess and unlock development potential. The ability to instantly access accurate zoning data across Ontario gives our team and clients the confidence to move faster and make smarter decisions. It’s an exceptional tool that has raised the bar for due diligence and site evaluation.”
Masoud Abdar Esfahani, CEO
» AECORN Realty «


On-demand reports
Get reports instantly.
No sign in required.
LandLogic also offers its property reports on-demand, no subscription needed. Just type an address in and buy a report.
Basic zoning report
Enhanced zoning report

Site assessment

School report
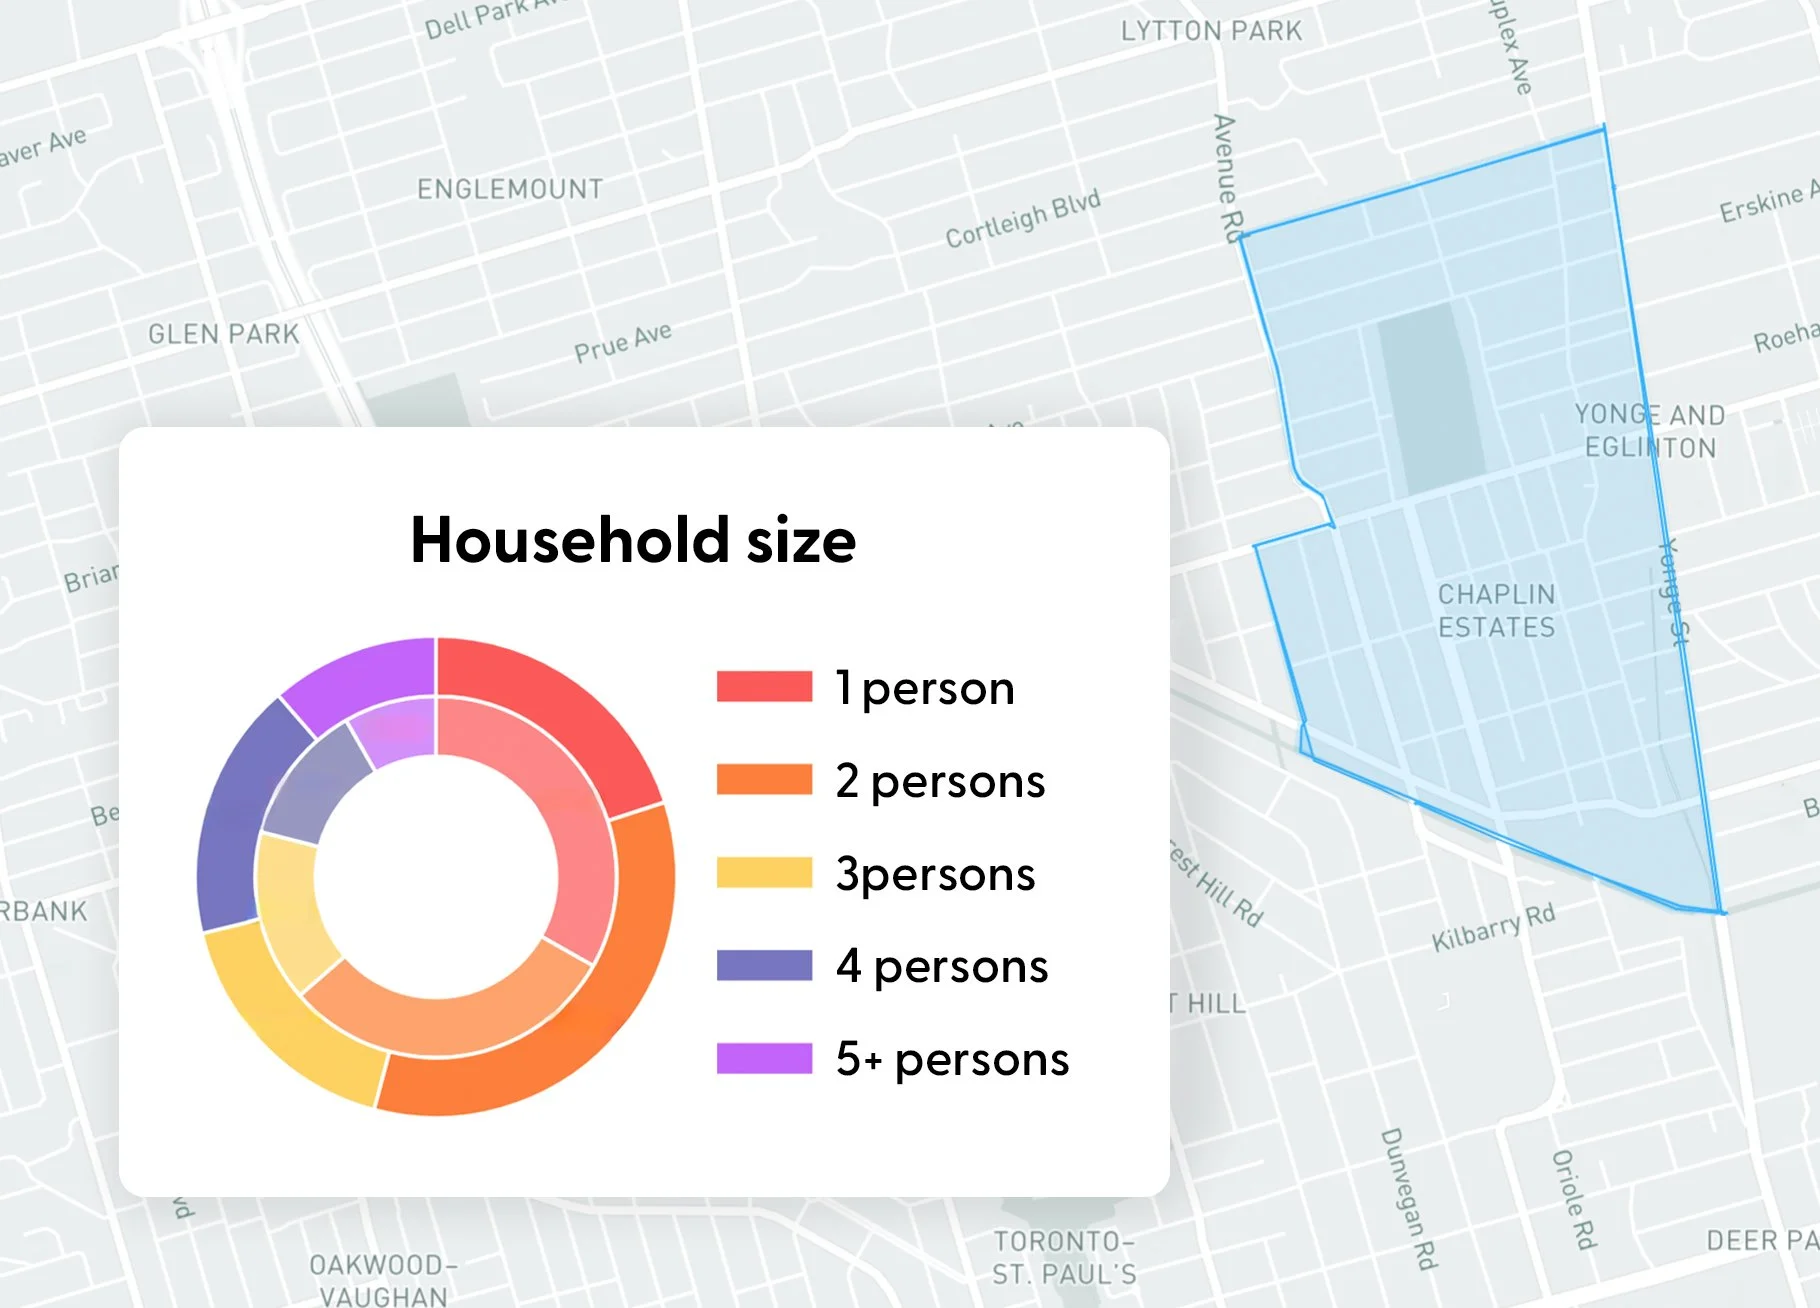
Demographics report
Featured products
Where land data becomes
a scalable ecosystem.
Meet the products built on our parcel-level intelligence: engineered to streamline analysis, eliminate friction, and accelerate decisions.
Site selection
Find the perfect site, in seconds.
Search high-potential sites in seconds and move projects forward with confidence. Easily answer questions like: Where can I…
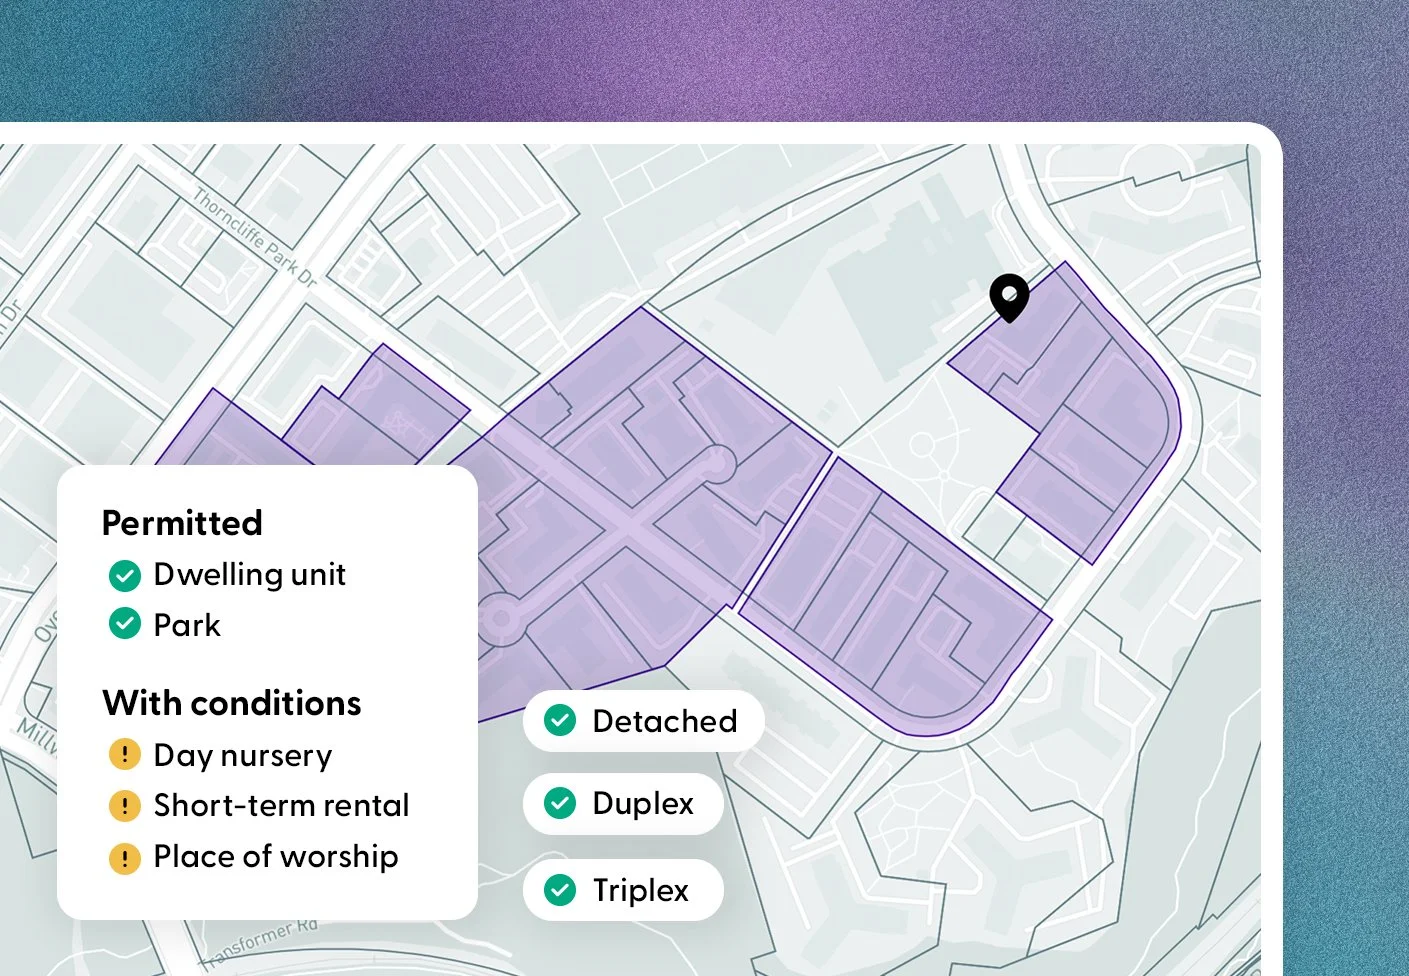
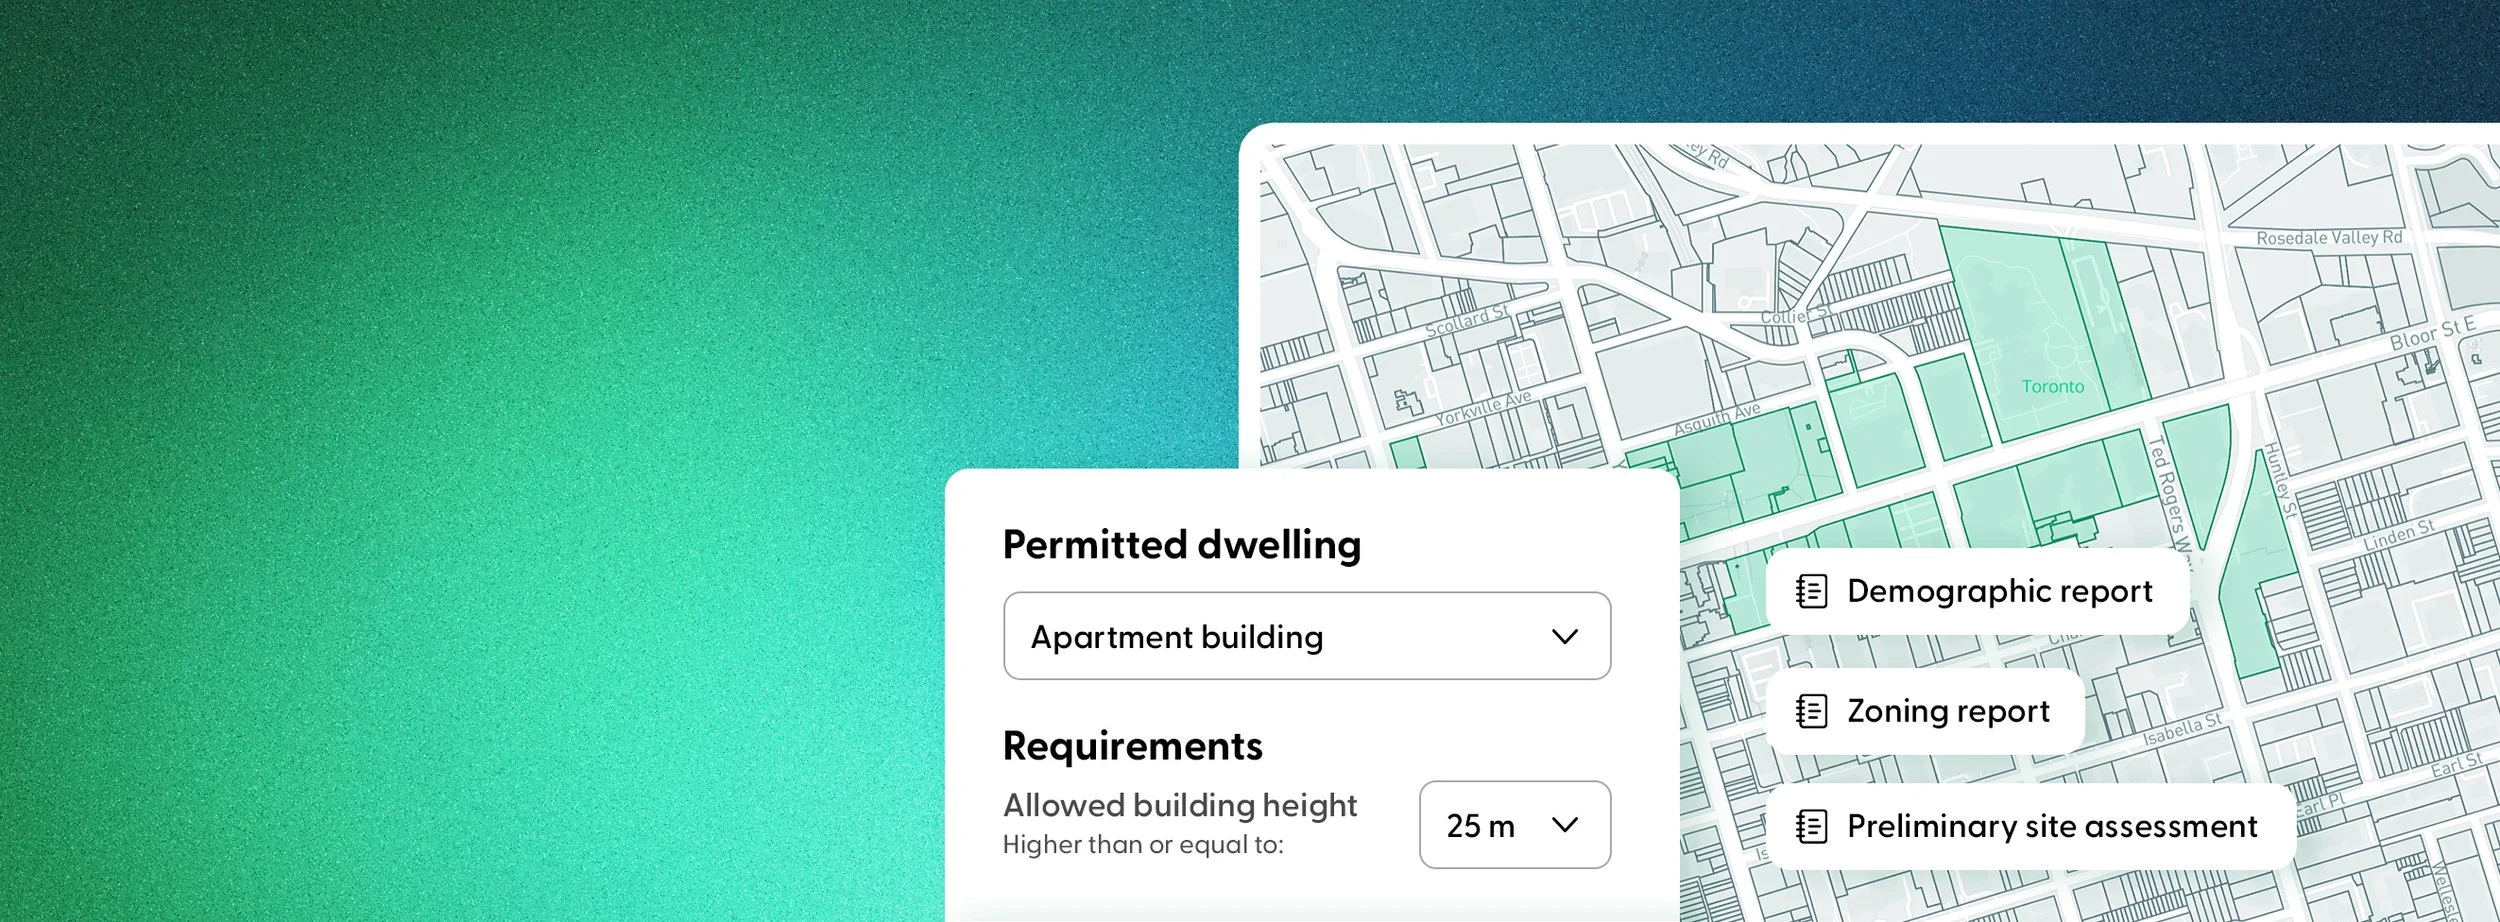
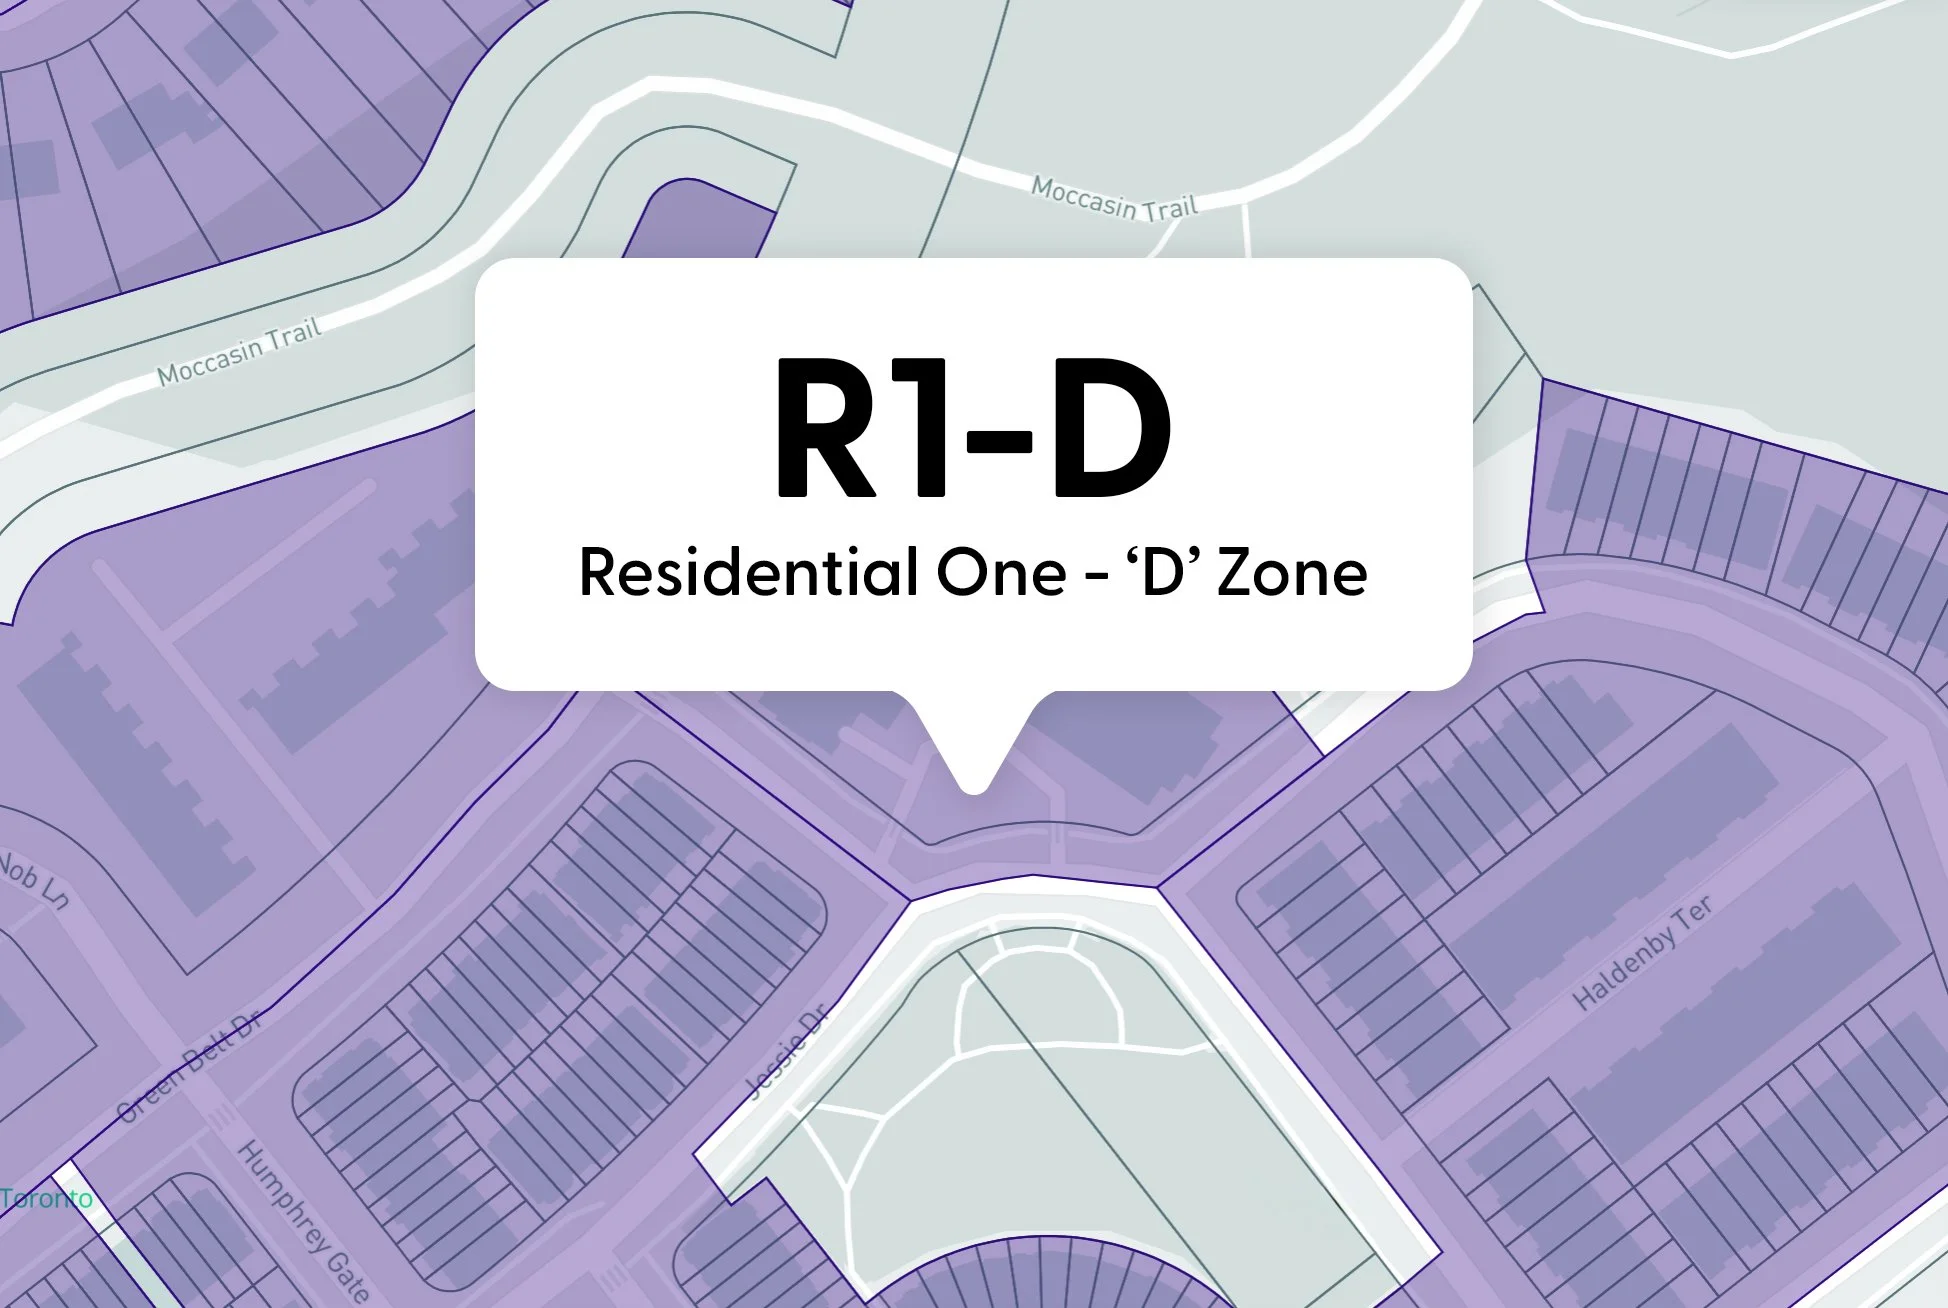
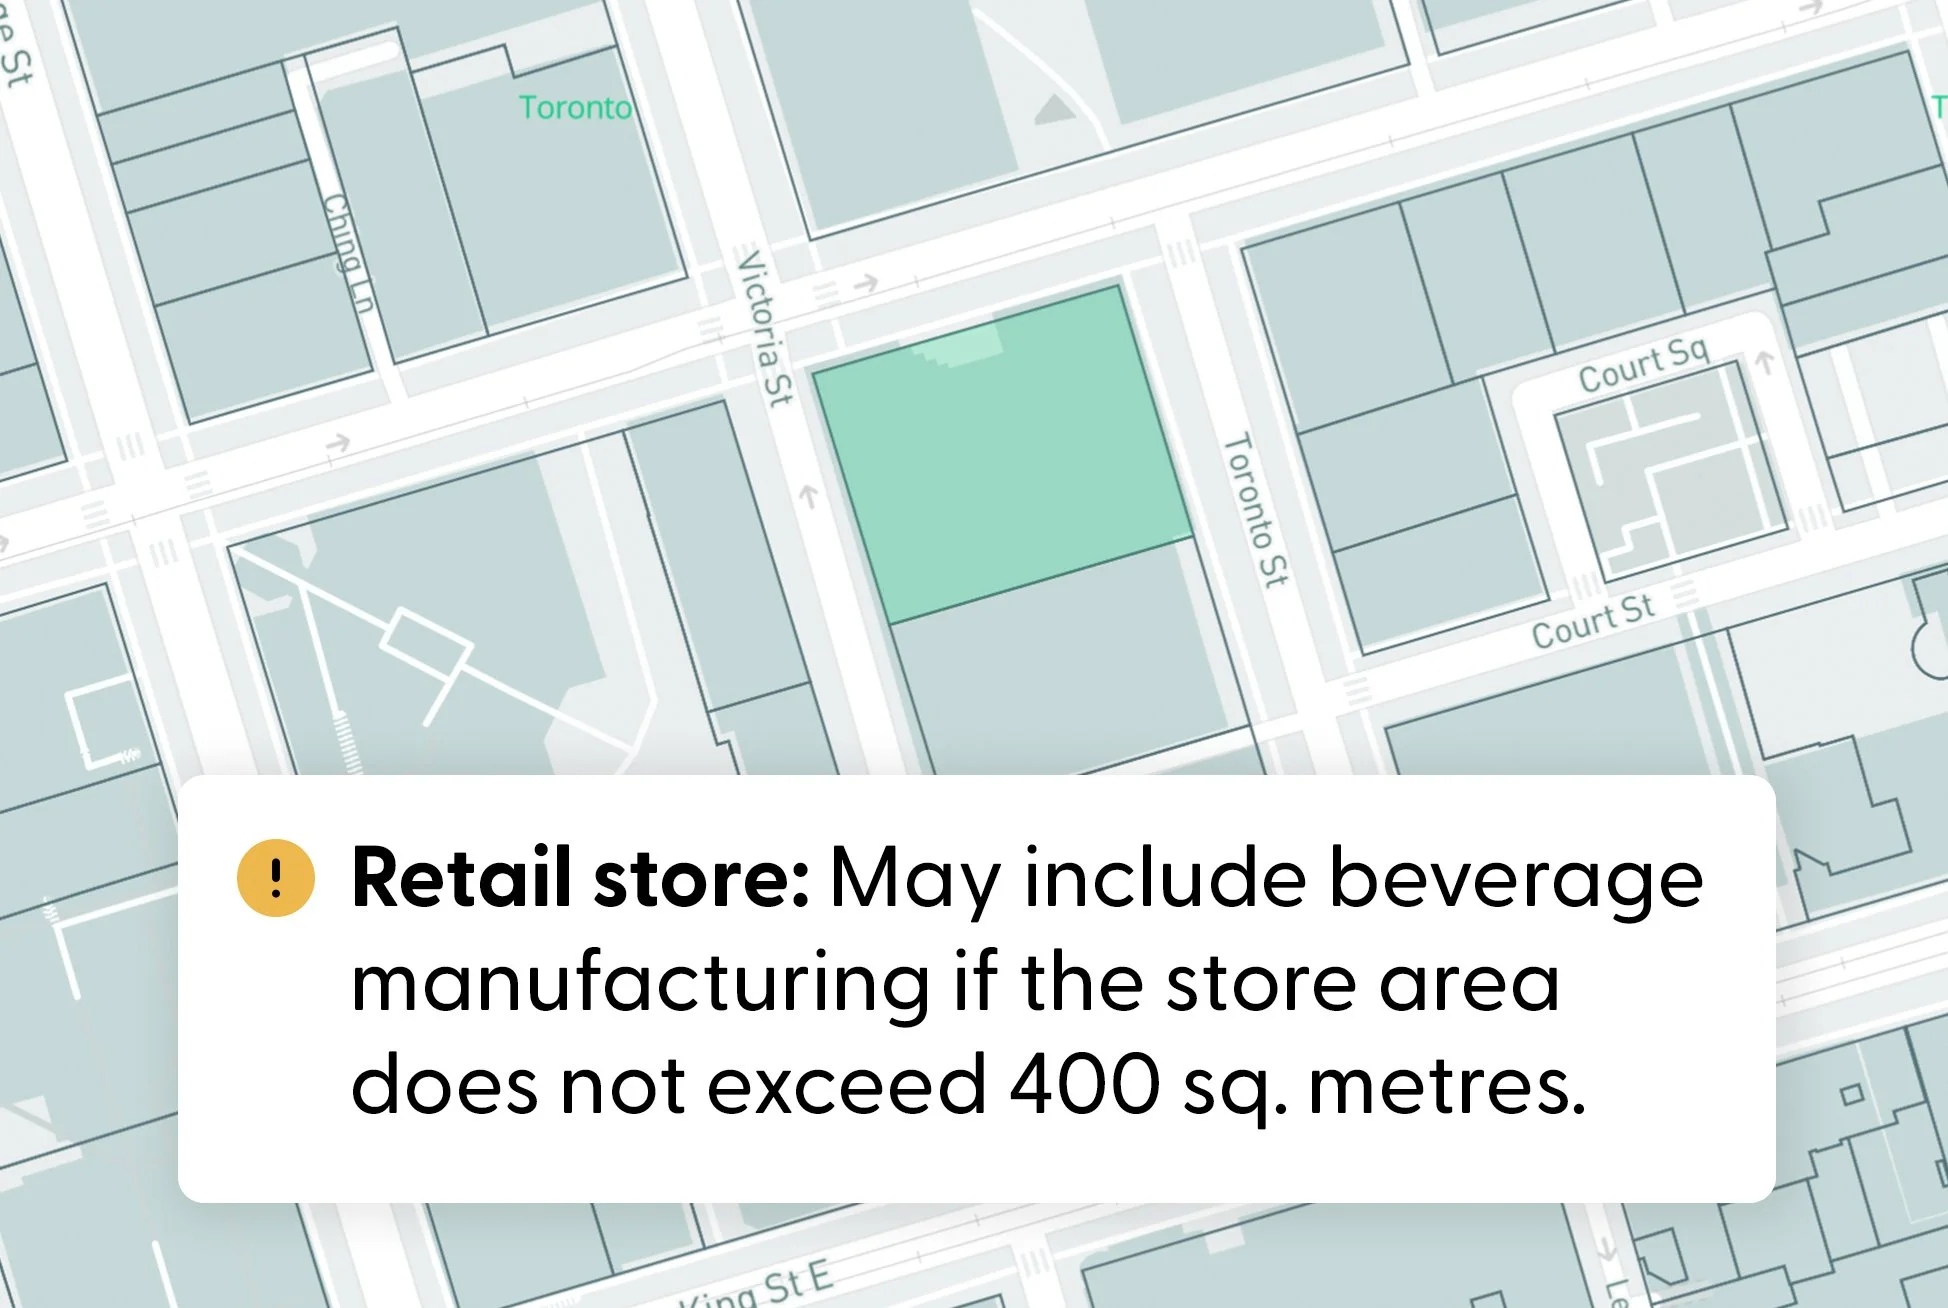
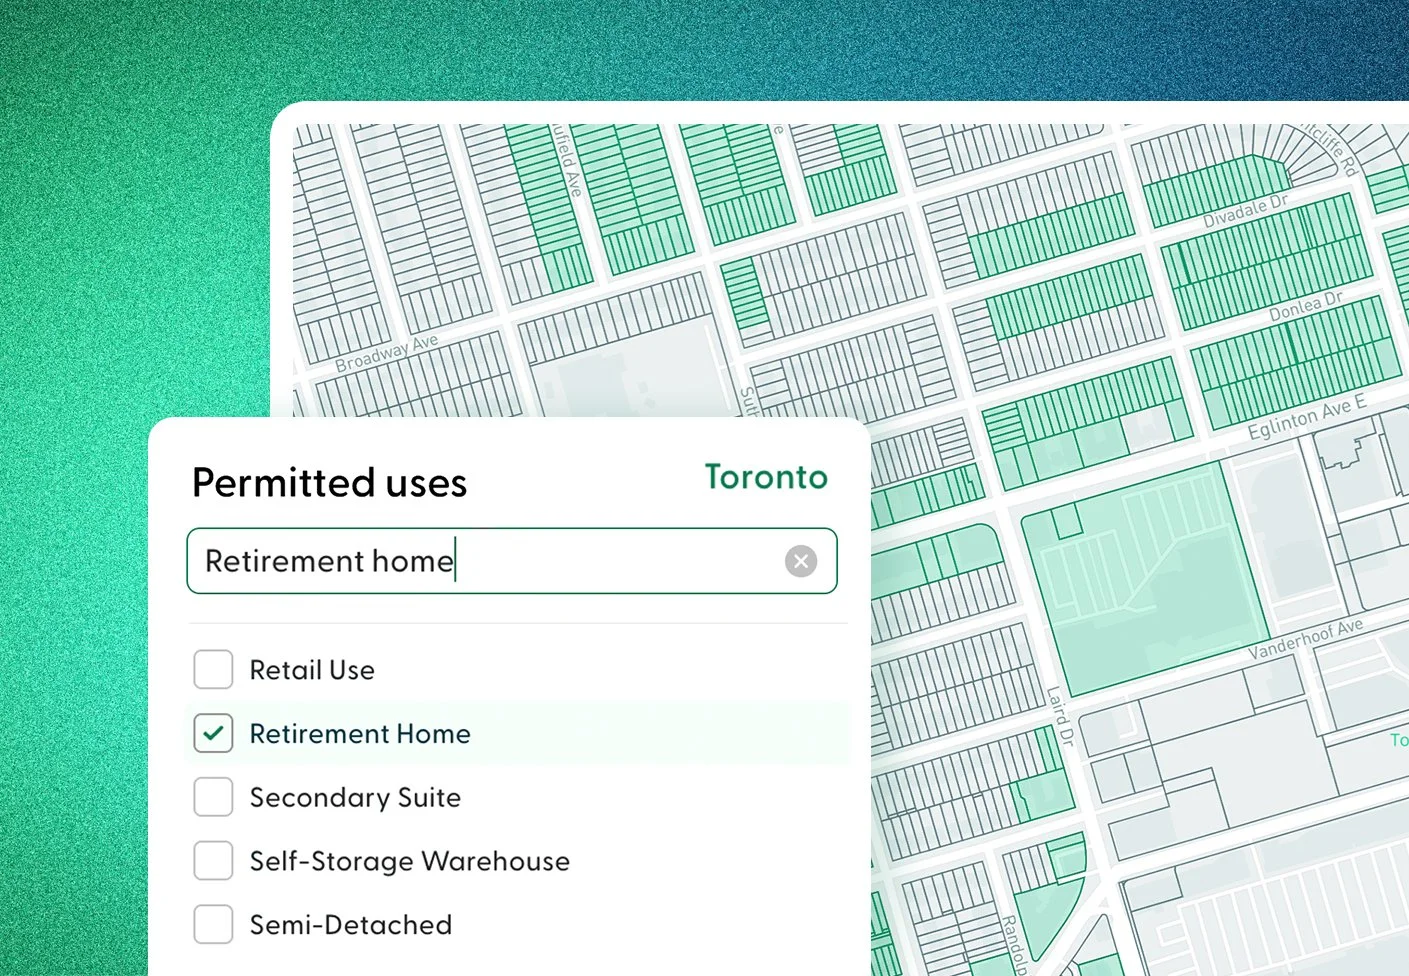
Zoning insight
Get your highest and best use.
Understand what's permitted on a parcel. Skip hours of bylaw reasearch and get clear answers to questions like: Can I…
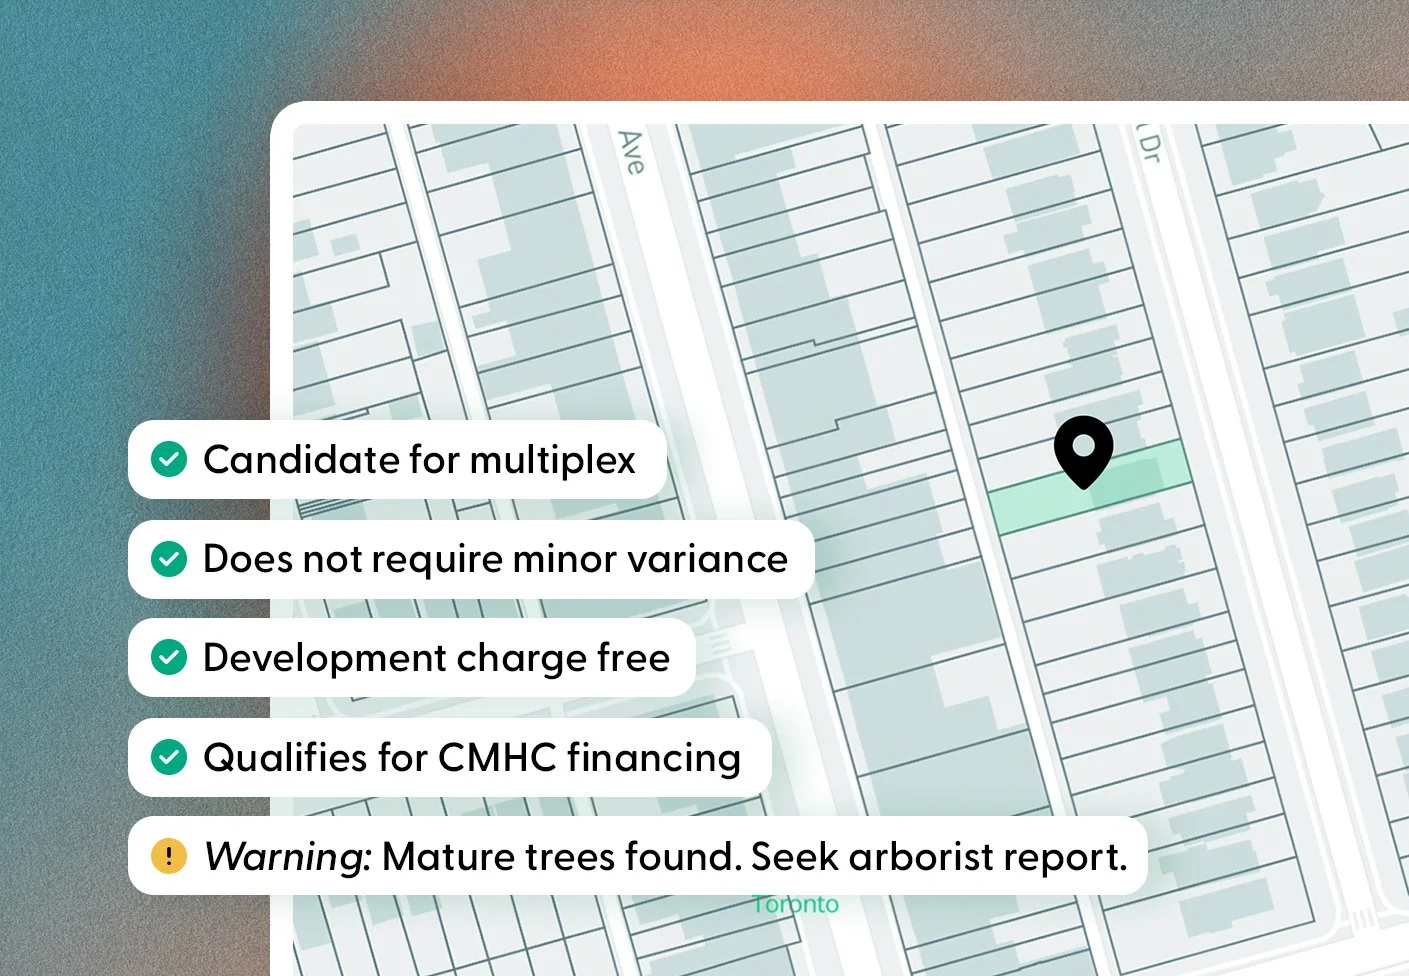
Multiplex evaluation
Discover your multiplex potential.
Quickly assess if a property is viable for a multiplex and uncover what's buildable. Get fast answers to: Can I…
Preliminary site assessment
Evaluate risk and opportunity.
Get a snapshot of site risks, constraints and nearby acvitity to make faster go/no-go decisions. Answer questions like: Are there...…

Meet our data
The backbone of
property intelligence.
Our AI-standardized data forms the support system that property solutions need to deliver accurate, reliable insight.

Real-time
Data is updated as regulations are released.

Multi-modal
1000+ data sources
90+ data categories

Standardized
Unifed data from 80+ cities across Canada


Create an account to explore LandLogic products today, or contact us for a demo.